Debugger UI
The DeploySentinel Debugger UI allows you to view action logs, timings, interactive DOM snapshots, network events, console events and custom events from a single test run.

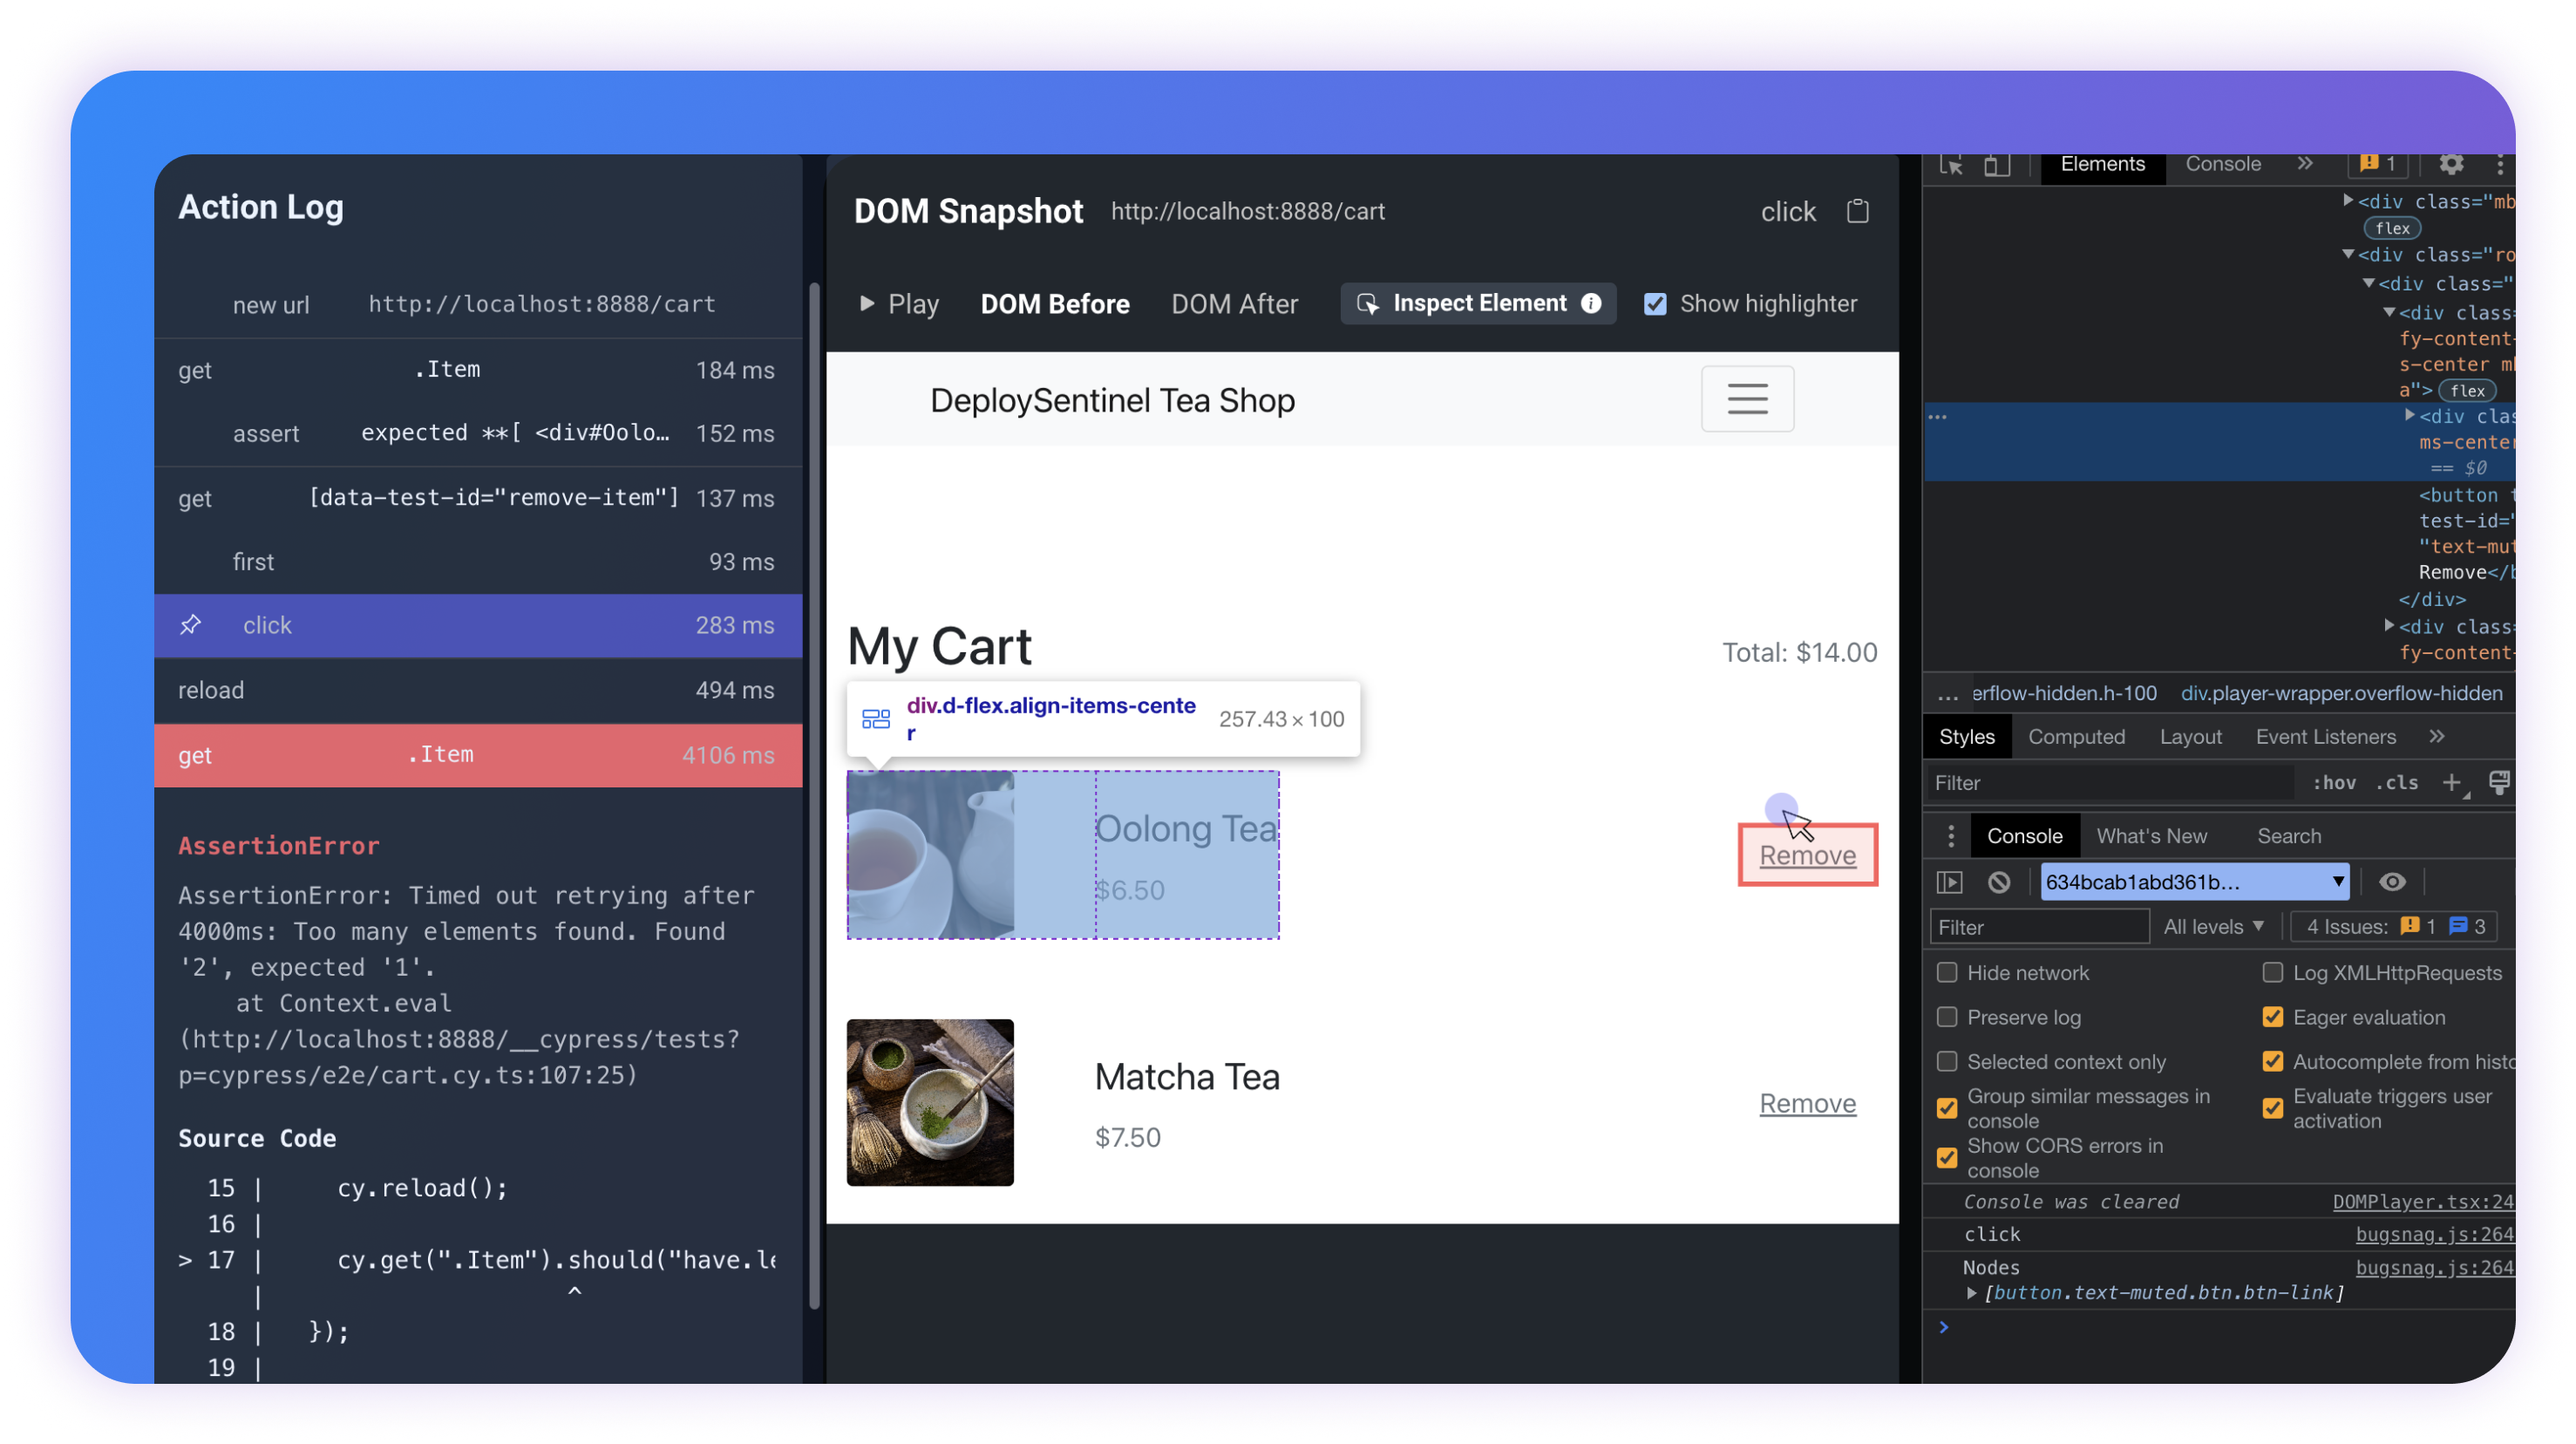
Inspecting DOM Elements
The DOM snapshot is fully interactive, so not only can you scroll around the snapshot to view elements outside of the viewport during the test, you can also use your browser's inspect element tool to view the actual DOM being rendered on the page at that point in time.
To inspect a given element, simply right click on the element inside the DOM Snapshot panel and click "Inspect" to use your browser's native inspect element tool.
Viewing Action Metadata
Actions such as get, wrap, request will print out action metadata such as
the element it interacted with, the wrapped object or the request/response pair
inside your browser's console.
To access the action metadata, open your browser's console and then hover over the action you'd like to view metadata for.