5 Ways to Better Debug Failing Cypress Tests in CI


Debugging Cypress tests when they fail only in CI can be a challenging task. With the right tools and techniques, it’s possible to gather the debug info needed to fix a test, instead of just hitting retry one more time.
We’ll walk through a few tips you can use to pull more debug information out of your Cypress tests when they fail in CI.
Add Debug Data via cy.log

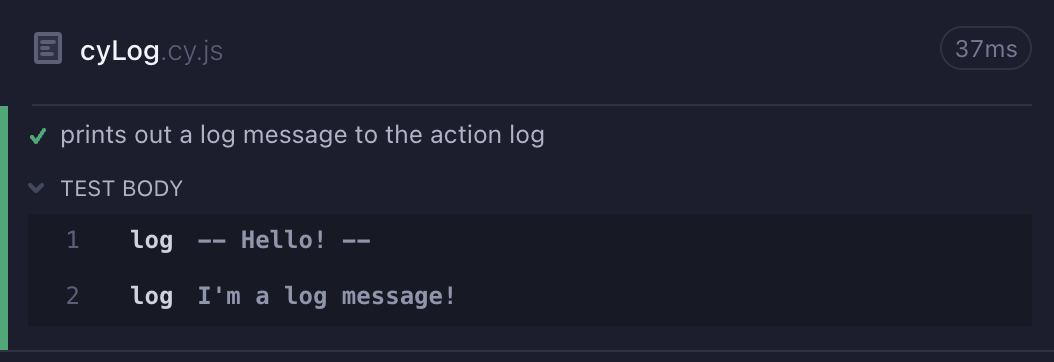
cy.log is a powerful tool to help annotate your tests with debug information
for both local and remote development. cy.log output will show up in the
command log UI and console.log of the test browser. This means in CI,
information in cy.log can be seen in the screenshots or videos.
You can use cy.log to anotate what part of the test is running, or to print
out test state like the ID of the fake user that's being used in the test to
correlate with backend logs.
While this is the easiest method of adding additional debug information, the fact that it’s limited to being shown in videos or screenshots makes its utility limited.
Output Debug Data via stdout

Often times debugging starts with looking through the logs of your CI output.
However, you’ll quickly realize that regular console.log in Cypress tests
won’t actually show up in your CI logs. While cy.log can help surface
information inside of a video or screenshot, we can actually push data directly
into standard output/CI logs.
We’ll need to do this via introducing a new cy.task to push debug information
from your test script running in the browser, to the Node process that can
output the information to the CLI.
In your Cypress config file (cypress.config.js) you’ll need to define the
following :
const { defineConfig } = require('cypress');
module.exports = defineConfig({
e2e: {
setupNodeEvents(on, config) {
on('task', {
log: message => {
console.log(message);
return null;
},
});
},
},
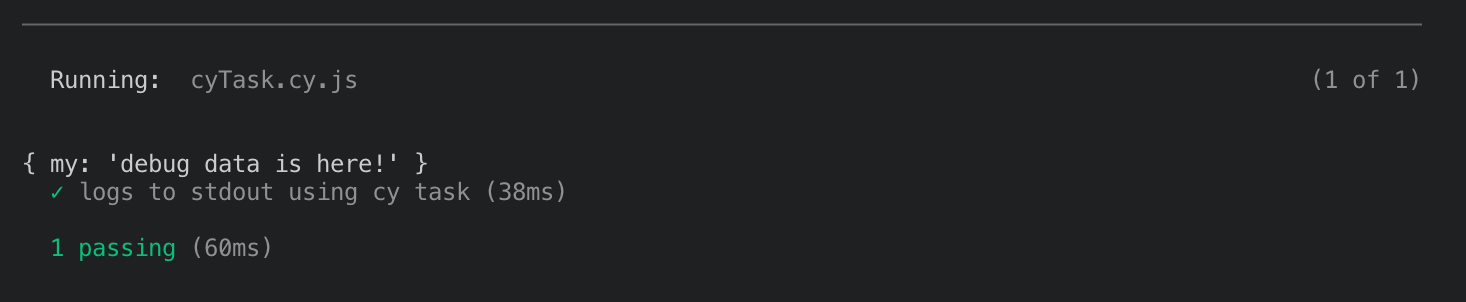
});Now within your test, you can easily call cy.task("log", ...anyDebugDataHere);
to output debug information straight into your CI logs.
Install Terminal Report Plugin

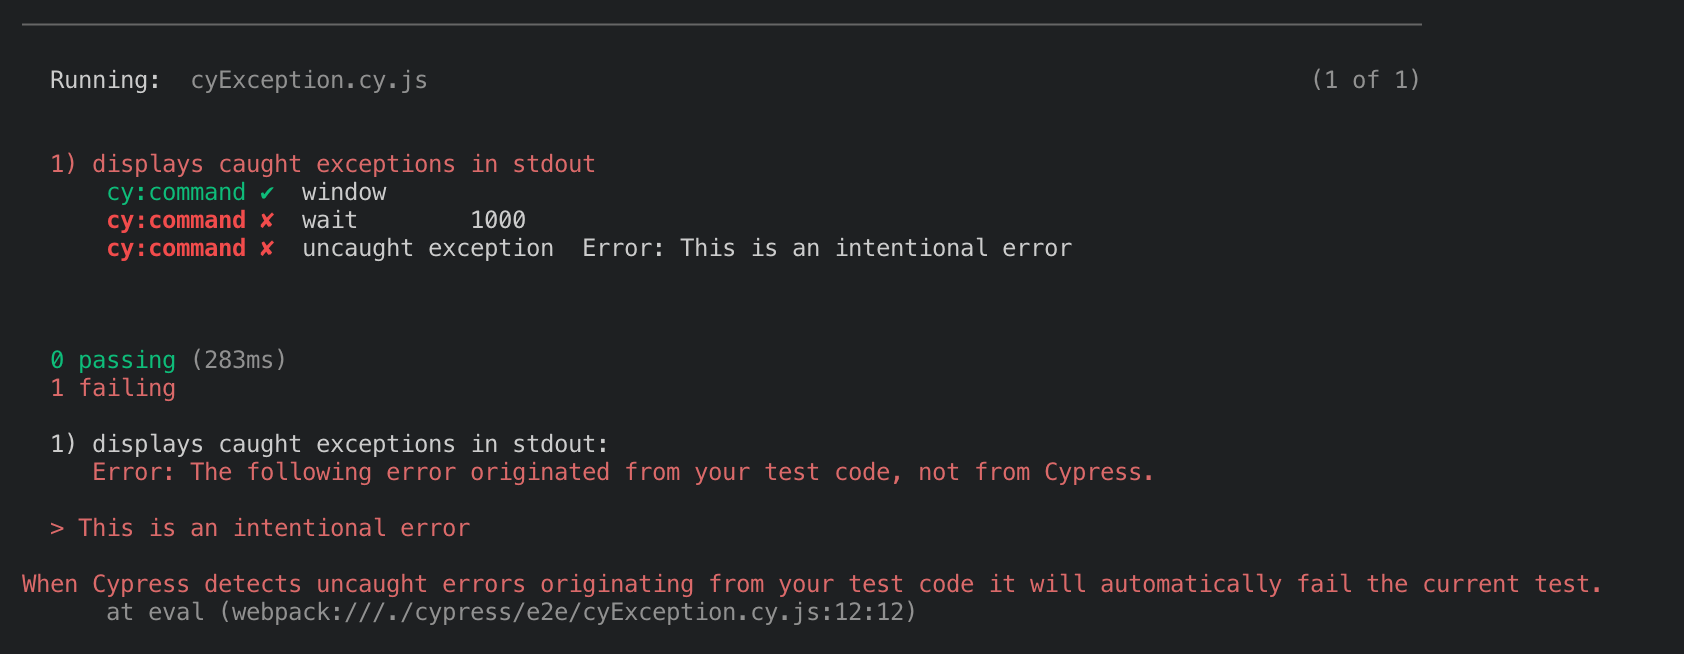
Cypress terminal report (opens in a new tab) is
an open source Cypress plugin that outputs actions, intercepted requests,
console messages and errors directly to stdout in a convenient format. It’s a
more-complete version of using either cy.task or cy.log to output basic
debug information to the CLI and can help surface more debug information for
tricky test cases.
Getting it installed is really easy:
- Run
npm i --save-dev cypress-terminal-report - Install the plugin (in
cypress.config.js)
module.exports = defineConfig({
  e2e: {
    setupNodeEvents(on, config) {
      require('cypress-terminal-report/src/installLogsPrinter')(on);
    },
  },
});- Install the support file (in
cypress/support/e2e.js)
require('cypress-terminal-report/src/installLogsCollector')();Afterwards you’ll be able to see action logs and other debug information in your stdout when a test fails.
Output Verbose Debug Logs from Cypress

If the test failure is particularly tricky, you can try enabling debug logs in Cypress to check for issues around excess memory/CPU usage (which can cause flakes) or specific network errors.
You can enable network logging by prepending DEBUG=cypress:net* in front of
your Cypress run command like the following:
DEBUG=cypress:net* yarn run cypress run --browser chrome
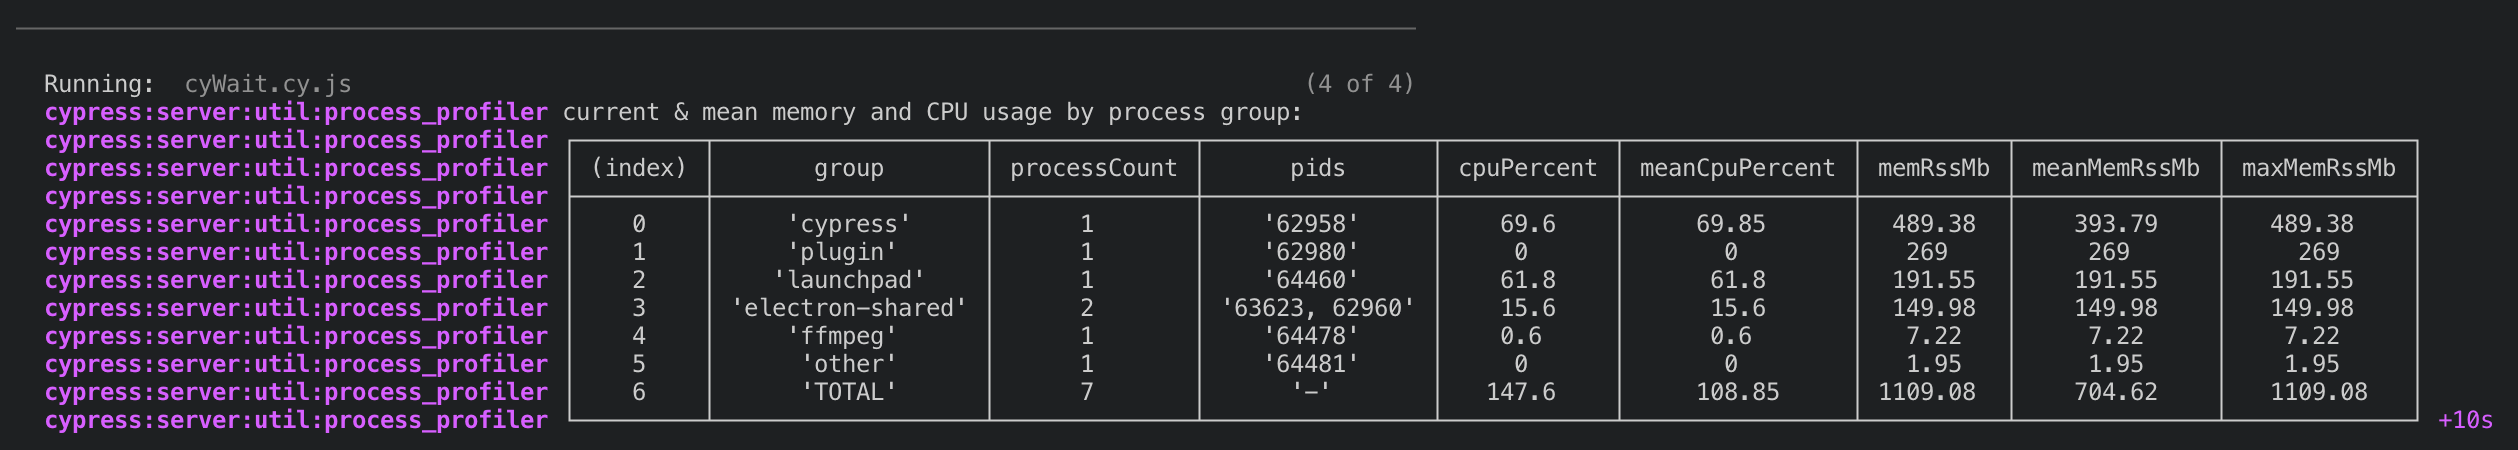
You can enable memory/CPU logging by prepending
DEBUG=cypress:server:util:process_profiler in front of your Cypress run
command.
However, these log messages are typically extremely verbose and can be difficult to sift through, so I’d only recommend trying to use these as a last resort, and keeping them disabled normally to keep your CI logs usable.
Install DeploySentinel Cypress Debugger Plugin

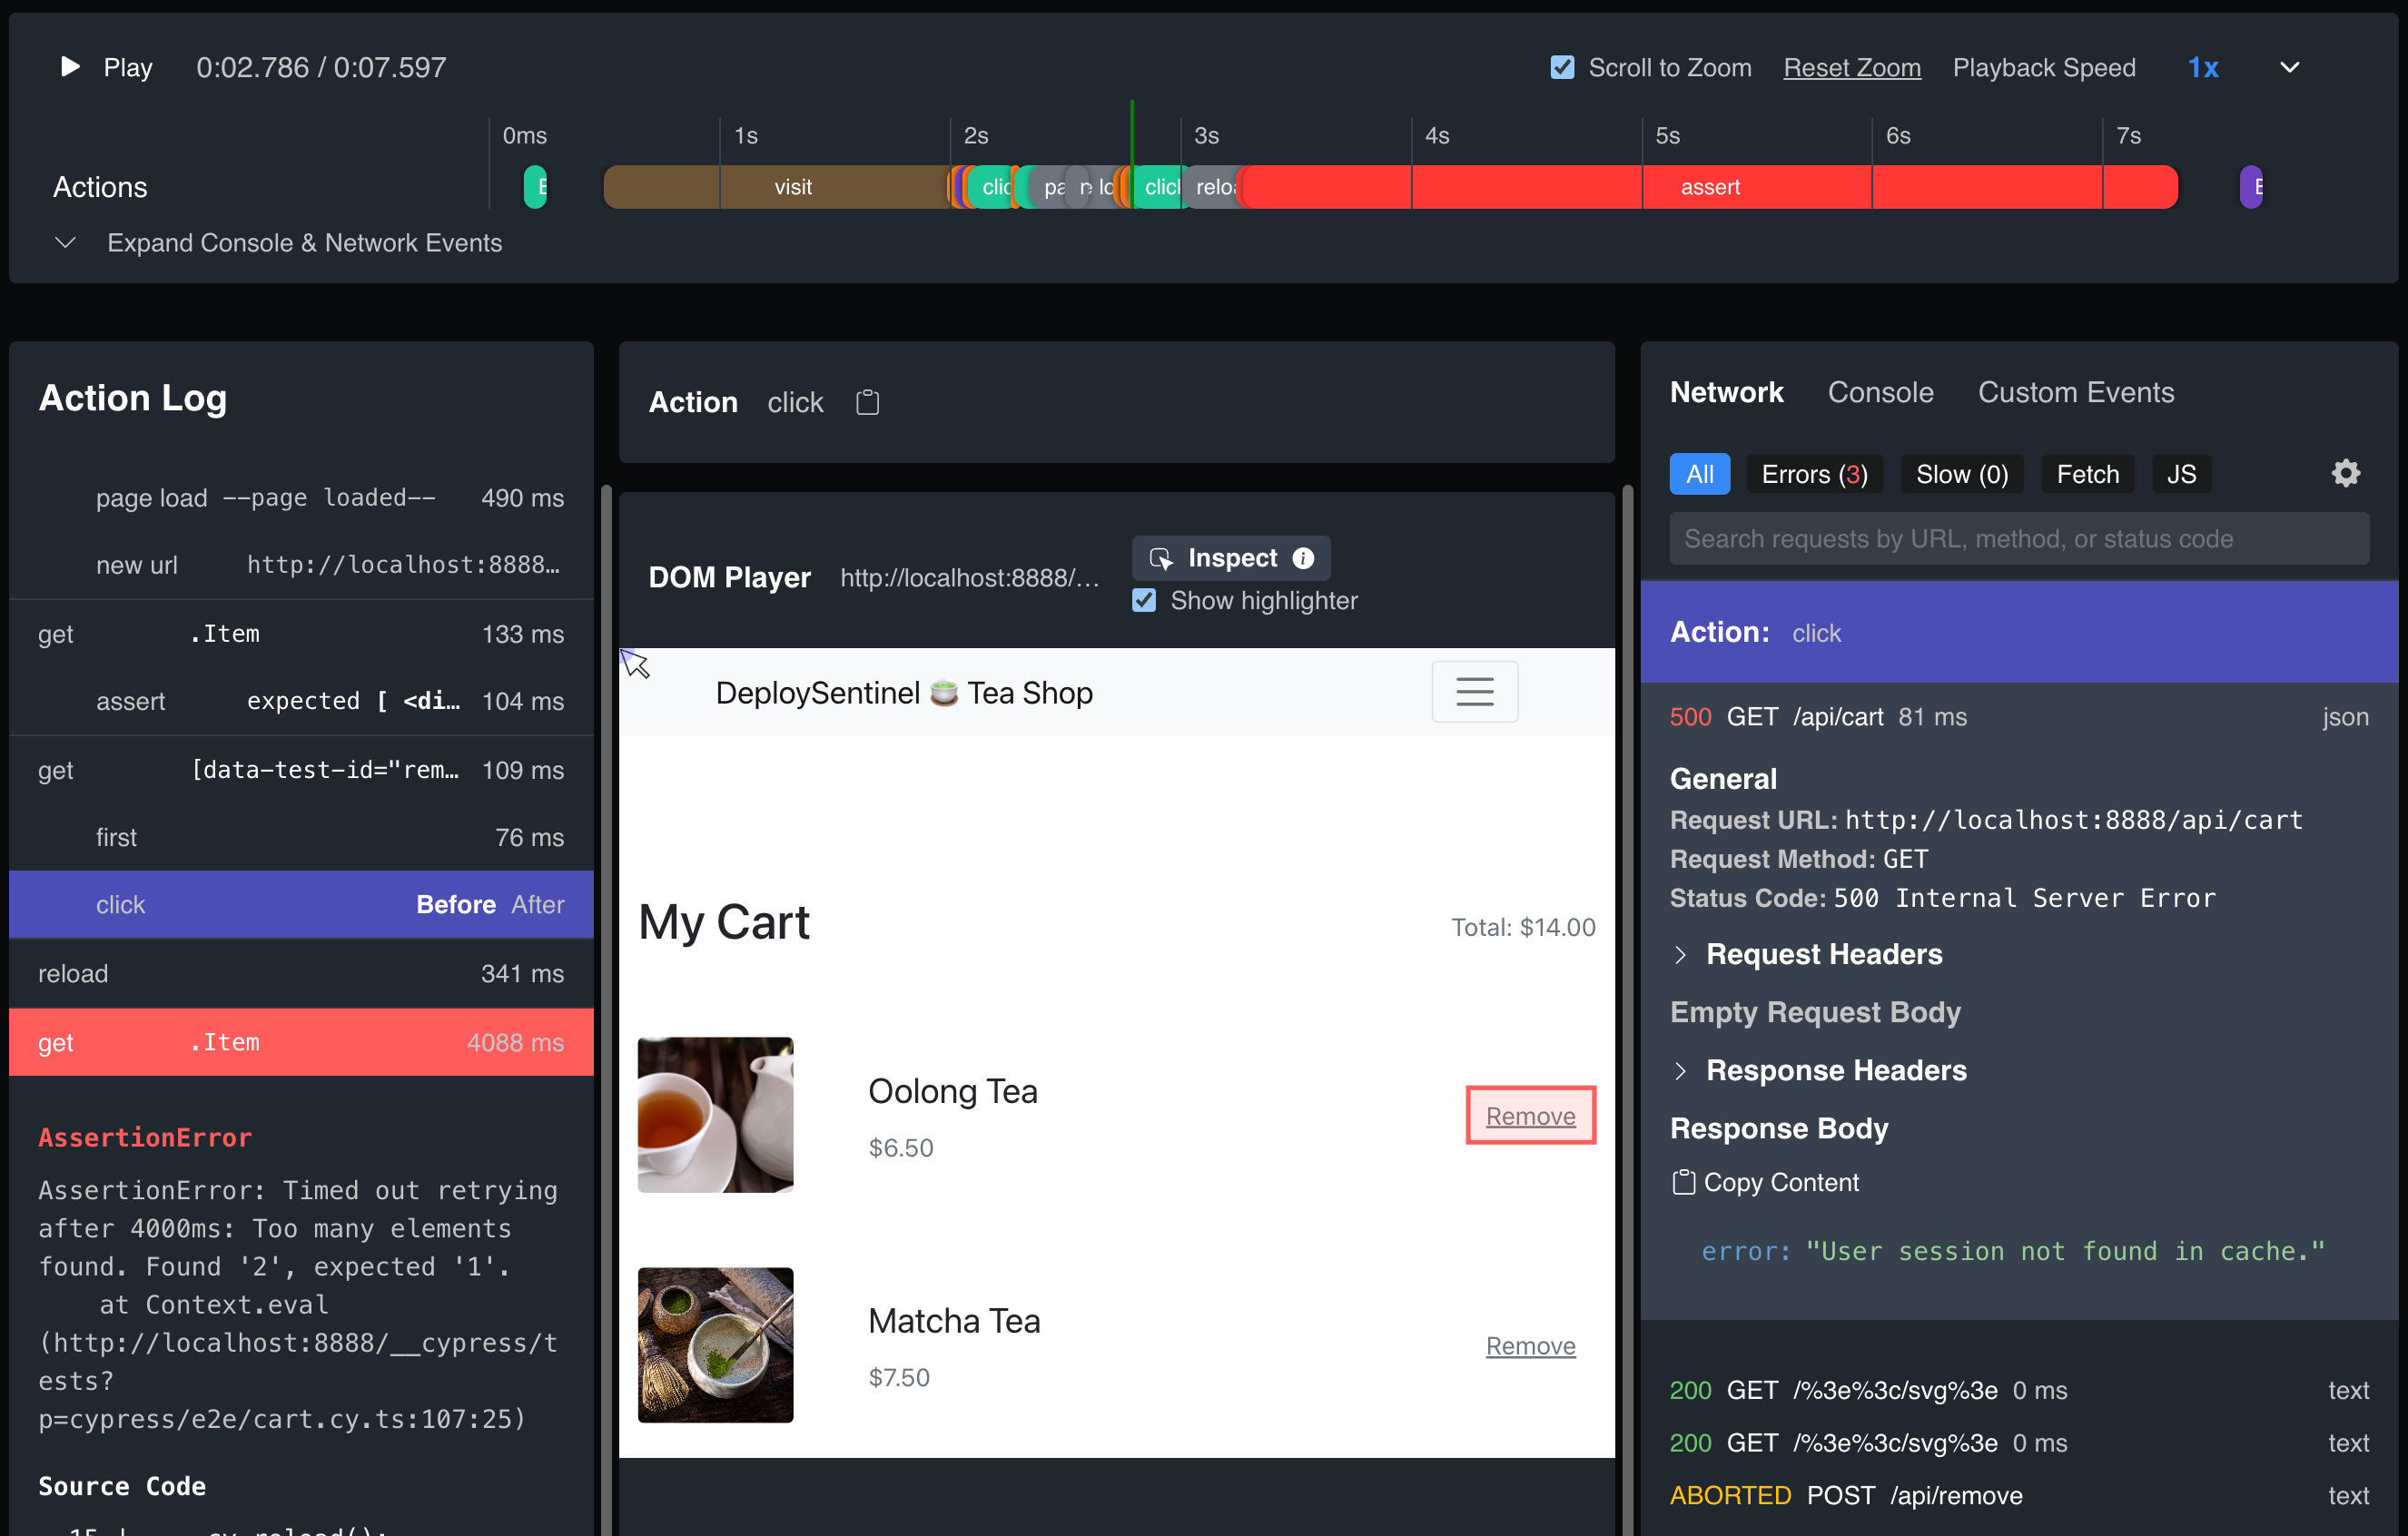
The
DeploySentinel Cypress debugger plugin (opens in a new tab)
automatically collects every DOM snapshot, console logs, network request, memory
usage, and more automatically and displays it within a cypress open-like
debugging interface. It makes it easier to sift through and correlate mountains
of debug information that can be put out by the tools above.
Getting it installed is as easy as any other Cypress plugin:
- Run
npm i --save-dev @deploysentinel/cypress-debugger - Install the plugin (in
cypress.config.js)
const { defineConfig } = require('cypress');
module.exports = defineConfig({
  e2e: {
    setupNodeEvents(on, config) {
      [on, config] = require('@deploysentinel/cypress-debugger/plugin')(
        on,
        config,
      );
    },
  },
});- Install the support file (in
cypress/support/e2e.js)
import '@deploysentinel/cypress-debugger/support';- Run with a DeploySentinel API key (get started for free (opens in a new tab))
CYPRESS_DEPLOYSENTINEL_KEY=YOUR_API_KEY npx cypress run --browser chromeFrom there, you’ll be able to debug test failures directly in the DeploySentinel web app, with all the telemetry you can get locally, and more!